Record the details
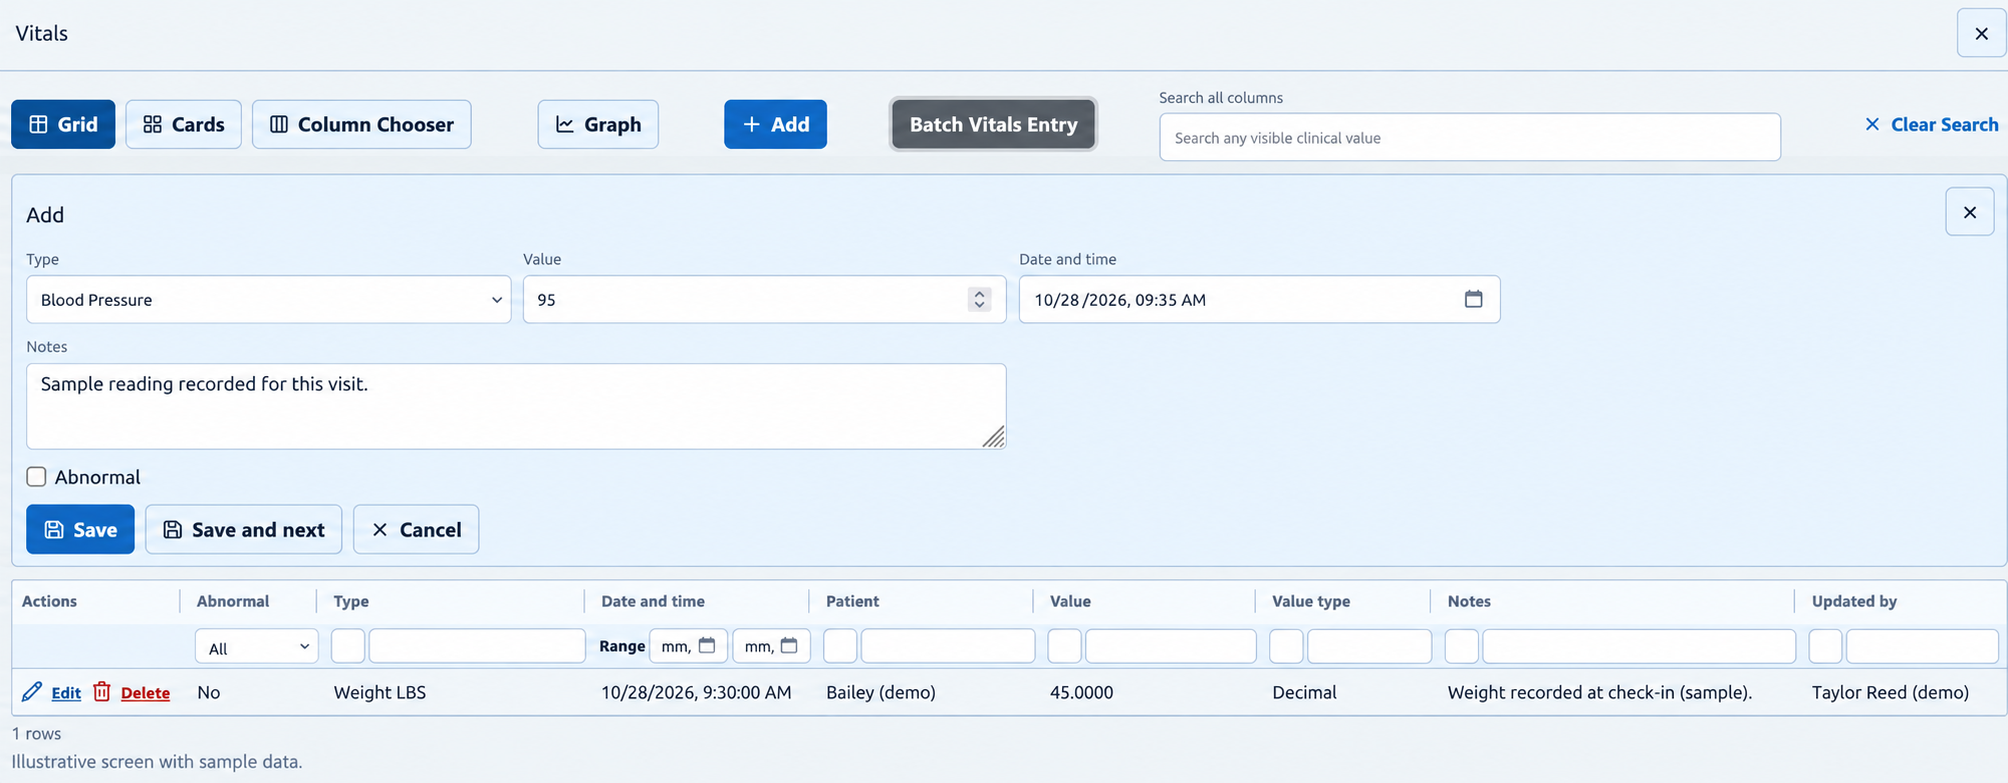
Choose a vital type and enter its value, date and time. Add notes or mark the entry abnormal when appropriate.
 Request a demo ↗
VITALS & PATIENT TRENDS
Record measurements for the visit, review their history, and use Patient Graphs to compare recorded vitals and lab results over time.
FROM ENTRY TO OVERVIEW
Individual vital entry, recorded history, and graph controls give your team different ways to review the information already recorded for a patient.
Reference ranges are available where applicable.Choose a vital type and enter its value, date and time. Add notes or mark the entry abnormal when appropriate.
Review recorded entries with their values, dates, notes and updated-by information in the Vitals grid.
Normal reference ranges are available where applicable, providing context alongside the measurements your team records.
PATIENT GRAPHS
Focus on recorded items and a time-range view, then choose how to display the information. This example shows the Vitals data source with the Area chart selected.
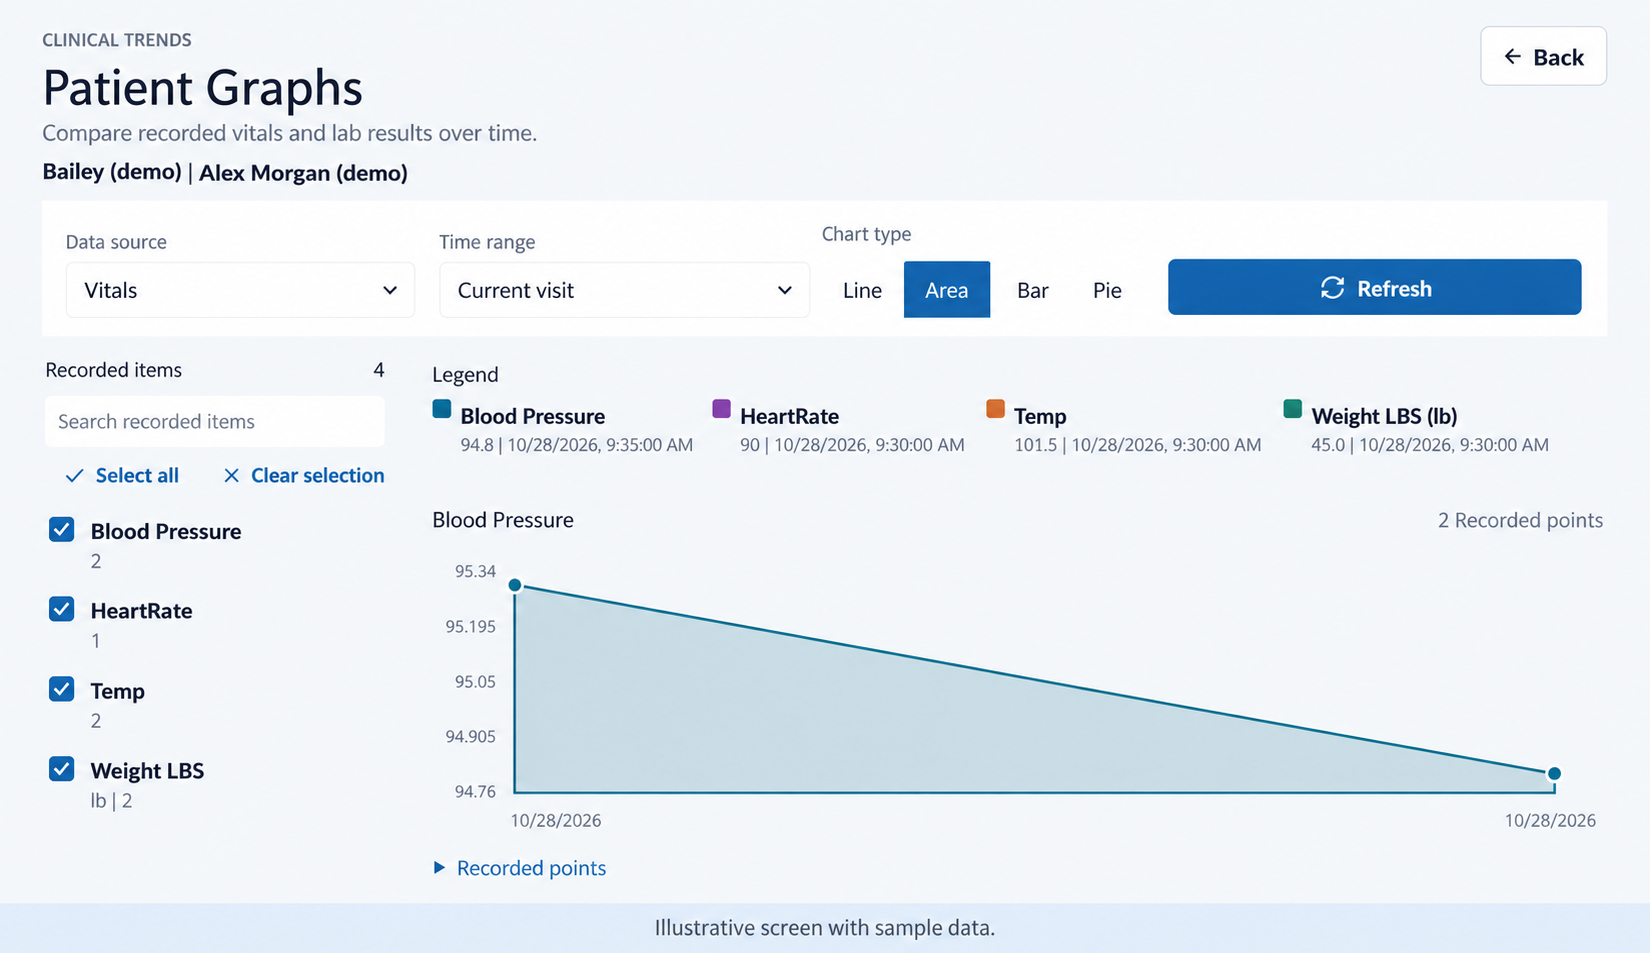
Use the data-source and time-range selectors. Vitals and Current visit are shown in this example.
Search the recorded-item list, select individual items, or use Select all and Clear selection.
The screen provides Line, Area, Bar and Pie controls, plus Refresh and a recorded-points disclosure.
THE RECORD BEHIND THE GRAPH
The individual entry form keeps the vital type, value, date/time and notes together. The history grid below it provides a place to revisit earlier entries.
EXPLORE YOUR WORKFLOW
Walk through vital entry, history and Patient Graphs with the StringSoft team. Discuss the measurements and reference ranges used by your practice.